NTRACE ?This documents the options and parameters which NTRACE can accept. For detailed information on the command syntax see the Command section of this document. The following screen is displayed:
|
[C:\ibmcom]ntrace ? Network Trace for OS/2 Release 1.1
Network Trace Driver Control Application
v1.25C
The 32-bit OS/2 system does not support
12000Mb memory buffers
ntrace [TraceMb [#Segs]] [-fname]
[-l[name]] [-aN] [-s[NN]] [-m1|-m2]
where defaults to TraceMb
trace buffer, in Megabytes, <= 4095
(4)
[C:\ibmcom]
|
Note that the full display of this screen is larger than the default OS/2 command prompt will display in a VIO window (25 lines). In the previous example, we have increased this window to have 40 lines using the following command:
MODE 80,40This is recommended to maximize the output that is visible. However, this is not always possible when using remote access technologies such as telnet or Netfinity.
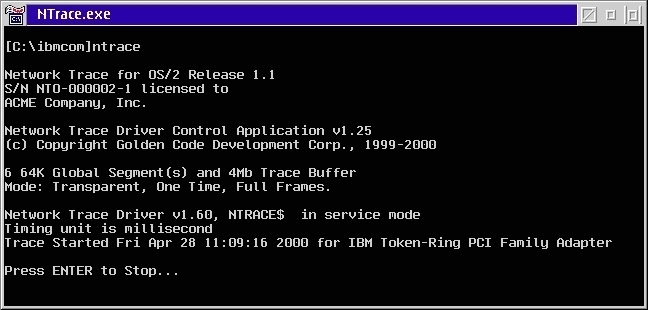
If NTRACE is started without parameters, a trace will be started. The following is an example of the output in this case:
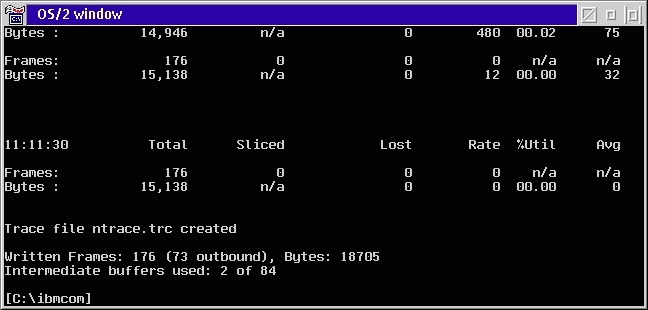
Notice at the bottom of the screen, there are lines of text printed, showing the number of frames and bytes currently captured. These status lines are printed every 15 seconds until the trace is stopped. See the Statistics section for more detail on this feature.
To display the trace session statistics on the screen AND to write this same text to a logfile of the user's choice, use the -l option. This is very helpful because it records these statistics and information about any lost frames, for future reference.
If there is more than one MAC adapter to which this instance of the NTRACE.OS2 is bound, then the -a option may be required. The -a option defaults to the adapter at index position 0. If NTRACE.OS2 is only bound to one adapter, then this adapter is always index 0. However, when there are multiple adapters, the -q option can be used to display a list. If your installation uses one NTRACE.OS2 instance for each MAC adapter (one NTRACE.OS2 line in CONFIG.SYS for each MAC adapter), then this is never an issue. See the Troubleshooting section for more details.
To stop the trace, the user presses the "ENTER" key. This will save the current trace buffer to the specified file. If one time mode (-m1) is selected Network Trace will stop once the RAM buffer is full. It is also possible to stop tracing by running NTRACE.EXE again, using the -k option.
If no filename was specified with the -f option, then the resulting default filename will depend upon the type of network being traced. If the network is a token-ring, then NTRACE.TRC will be the filename. If the network is Ethernet, then the name NTRACE.ENC will be used. In either case, a trace with the default filename will be created in the current directory.
If the user intends to ABORT this trace, CTRL-C or CTRL-Break can be pressed. This will end the trace WITHOUT saving any trace data. BE CAREFUL WITH THIS, AS THIS DATA CANNOT BE RECOVERED!!!
The trace completion screen is displayed after the trace has been stopped and contains information about the trace file that was created.