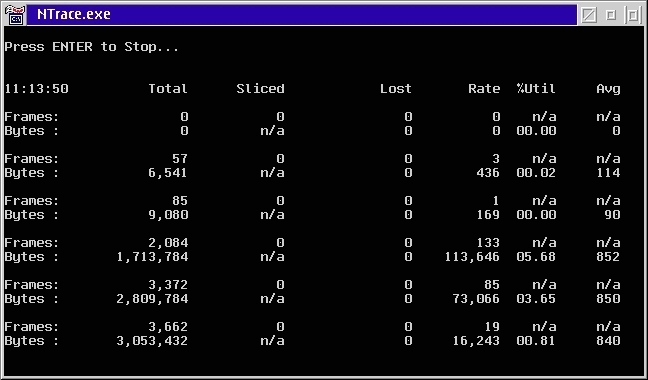
The following is a typical display of statistics during tracing:
|
|
|
|
| Total | The total number of frames received since tracing began. | The total number of bytes received since tracing began. |
| Sliced | The cumulative number of frames (since tracing began) that were artificially shortened to the maximum sliced frame size. | n/a |
| Lost | The cumulative number of frames lost due to software causes, since tracing began. In addition, there may be an indicator of frames lost due to hardware causes. See Lost Frames for more information on how to interpret these indicators. | The cumulative number of bytes lost since tracing began. The two causes of lost bytes are frame slicing and lost frames. |
| Rate | Frames/second measured over the current time interval. | Bytes/second measured over the current time interval. |
| %Util | n/a | LAN Utilization as calculated by the number of bytes/second compared to the maximum number of bytes/second for the media as reported by the MAC driver. |
| Avg | n/a | Average frame size in bytes, during the current time interval. |
In the NDIS Service-specific Statistics Table:
The syntax help for this utility can be obtained by running:
macstat ?The output from this command is displayed below:
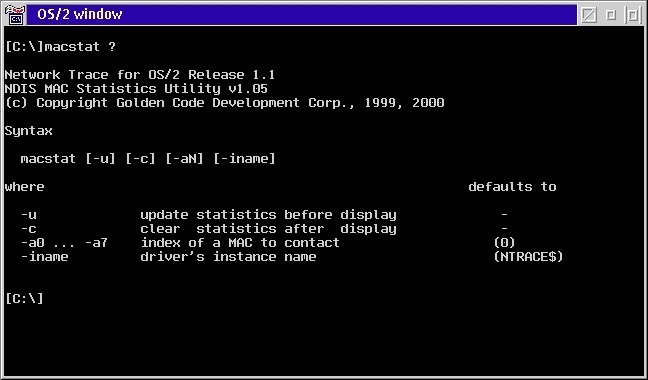
Statistics for the default NTRACE instance and the adapter 0 can be obtained by running MACSTAT with no parameters. It is important to note that MACSTAT is NOT a standalone utility. It requires the NTRACE.OS2 device driver to be installed and operational, in order to function.
Note that through MACSTAT, the user can clear the statistics and error counters in the MAC driver OR can force the driver to update these statistics before they are queried. These features allow the utility to support the full range of NDIS MAC drivers and the resulting variation in statistics support. Of course, some MAC drivers do not support statistics at all. In this case, MACSTAT is just as dependent upon the MAC driver as are the lost frame statistics that get displayed during tracing.
Sample output from MACSTAT follows:
Network Trace for OS/2 Release 1.1
NDIS MAC Statistics Utility v1.05
(c) Copyright Golden Code Development Corp., 1999, 2000
IBM EtherJet PC Card.
SERVICE-SPECIFIC STATUS:
Last diagnostic Date/Time
NEVER
MAC status - bit mask
0000001F:
Hardware
fully operational
MAC is bound
MAC is open/functional
Current packet filter
0003
directed
and multicast / group and functional
broadcast
Last clear stats Date/Time
391BA8F2
Frames received: total
3646
Receive fail: CRC error
0
Frames received: total bytes
2450189
Receive fail: lack of buffers
0
Frames received: multicast
0
Frames received: broadcast
709
Rcv fail: hardware error
0
Frames sent: total
2873
Frames sent: total bytes
2526057
Frames sent: multicast
0
Frames sent: broadcast
0
Send fail: time-out
NOT SUPPORTED
Send fail: hardware error
NOT SUPPORTED
ETHERNET MEDIA-SPECIFIC STATISTICS:
Version
1
Receive fail: Alignment error
0
Receive fail: Overrun
0
Frames sent: after deferring
NOT SUPPORTED
Frames not sent: Max collisions
0
Total late collisions
0
Frames sent: after 1 collision
0
Frames sent: multpl collisions
NOT SUPPORTED
Frames sent: CD heart beat
NOT SUPPORTED
Lost carrier sense during
tran 0
Total number of underruns
NOT SUPPORTED