Overview
Throughout this user manual, NTRACE and Network Trace for OS/2
are used interchangeably.
Functions
-
Network Trace turns any OS/2 computer into a network probe, without hindering
the normal network operation of the tracing machine.
-
Support for tracing on any NDIS 2.0.1 MAC driver, including drivers compiant
with IBM's NDIS extensions.
-
All traffic on attached network segments can be captured to a Sniffer compatible
trace file.
-
Dynamic control of tracing state (active or dormant).
-
Basic statistics are displayed while tracing.
-
Extensive logging to NDIS and OS/2 log files.
-
Utility to display MAC statistics.
-
Utility to display information about NDIS MAC driver capabilities.
-
Utility to dump NDIS binding tree and related data structures.
Features
-
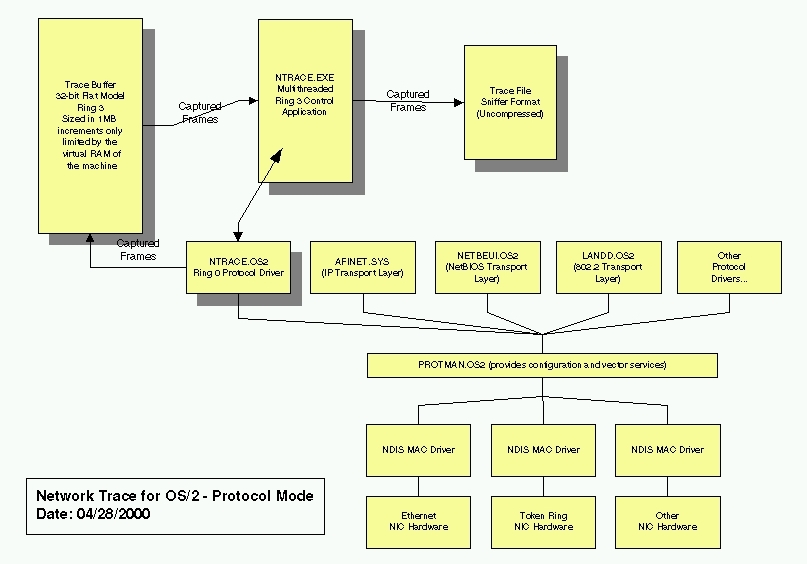
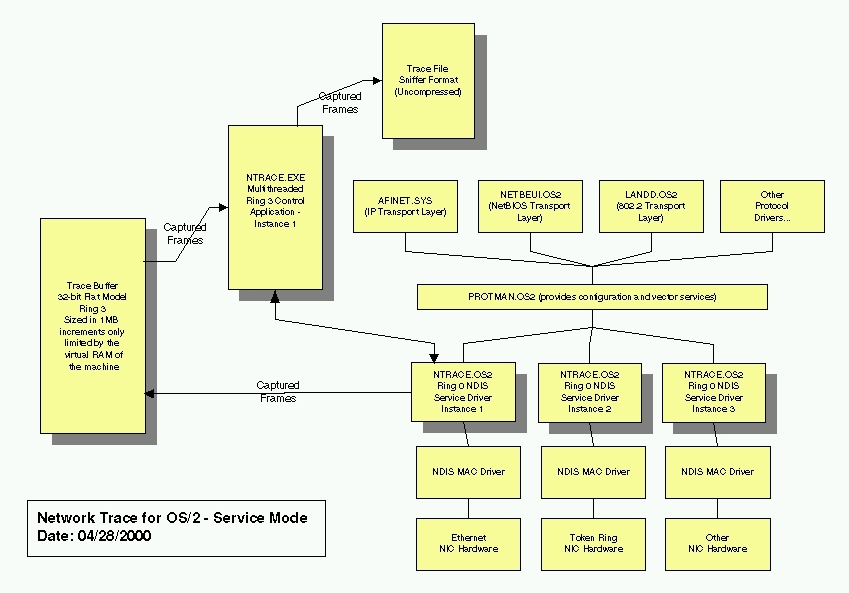
Software-only implementation with 2 modes:
-
PROTOCOL mode as an NDIS 2.0.1
protocol driver
-
SERVICE mode as an NDIS 2.0.1 "layer"
(binds in between the NDIS MAC and NDIS protocols)
-
Hardware independent design, allowing operation using any NDIS MAC of any
speed.
-
Multiple driver instances can be loaded, there is no limit on the number
of instances.
-
Binding to multiple MAC drivers:
-
In PROTOCOL mode, each driver instance can be bound to multiple MAC drivers
(maximum 8).
-
SERVICE mode, by NDIS design, does not allow an instance of NTRACE.OS2
to be bound to multiple MAC drivers.
-
Multiple driver instances can be tracing simultaneously. To simultaneously
trace on multiple MACs, multiple driver instances are required (both PROTOCOL
and SERVICE modes).
-
Very low system resource usage while dormant
-
31KB RAM
-
0% CPU in Protocol mode
-
<1% CPU in Service mode (so small we cannot easily measure the difference)
-
Allows control over number of reserved and used GDT selectors.
-
Allows control over size of the trace buffer in MB.
-
Statistics are displayed while tracing is in progress.
-
Filters:
-
2 types of filtering:
-
"PacketFilter" specifies which frames should be captured by NTRACE
-
"RejectFrames" specifies which frames should be forwarded to other protocols.
-
Filters can be specified at run time (via NTRACE.EXE command line arguments).
-
Default filter values:
-
RejectFrames can be set via PROTOCOL.INI.
-
PacketFilter is calculated by the driver at run time.
-
Support for logging to LANTRAN.LOG and/or FFST.
-
Command line user interface (NTRACE.EXE).
-
User specified output filename. Defaults to NTRACE.TRC or NTRACE.ENC
depending on the network type.
-
Sniffer (TM) compatible trace files. These files are NOT compressed.
-
2 buffering modes
-
One Time mode - the trace will automatically end when the trace buffer
is full (also known as "static once" mode).
-
Wrap mode - the trace buffer will overwrite itself if more data is captured
than can fit into the buffer (also known as "static continuous" mode).
The last X MB of trace data will be saved, where X is the size of the trace
buffer.
-
2 timing resolutions
-
Low resolution timing (time stamps with a resolution of 8 milliseconds).
-
High resolution timing (time stamps with a resolution of .83 microseconds).
-
User specified frame slicing. This allows a smaller trace to be captured,
faster. It is handy when all that is needed for analysis is the frame
headers.
-
Dedicated mode which allows:
-
full frames to be captured from adapters that would force frame slicing
(PROTOCOL mode only)
-
the highest possible frame copying performance in either SERVICE or PROTOCOL
mode
-
Tracing can be ended using the ENTER key OR using
the stop option to NTRACE.EXE. Trace data will be saved to
file.
-
Tracing can be aborted using CTRL-C or CTRL-Break. Tracing will be
ended and no trace data will be saved.
-
Query mode to display available adapters and basic characteristics.
-
License verification mode to verify and display the license key file.
-
Extended diagnostic mode for debugging the operation of tracing, especially
useful when investigating new hardware/MAC drivers.
-
Separate diagnostic utility(NTRDIAG) to report on the installation.
©
2000 Golden Code Development Corporation. ALL RIGHTS RESERVED