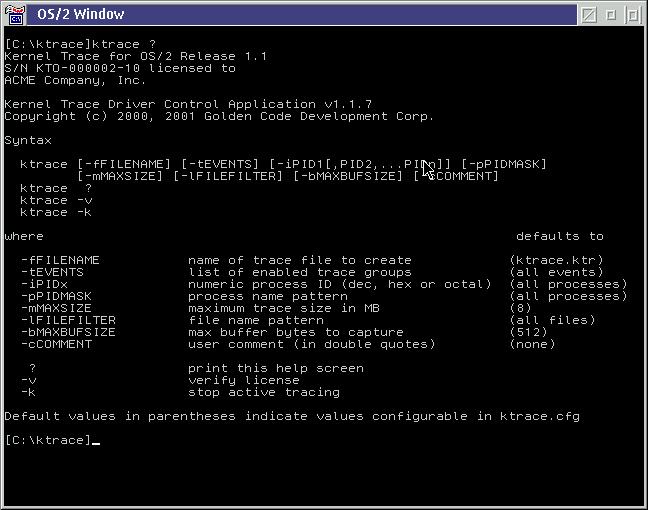
KTRACE ?This displays the options and parameters which KTRACE.EXE can accept. For detailed information on the command syntax see the Command section of this document. The following screen is displayed:
Note that the full display of this screen is larger than the default OS/2 command prompt will display in a VIO window (25 lines). In the preceding example, we have increased this window to have 40 lines using the following command:
MODE 80,40This is recommended in order to maximize the output that is visible. However, this is not always possible when using remote access technologies such as telnet or Netfinity.
If KTRACE.EXE is run without parameters, a trace will be started. The following is an example of the output in this case:
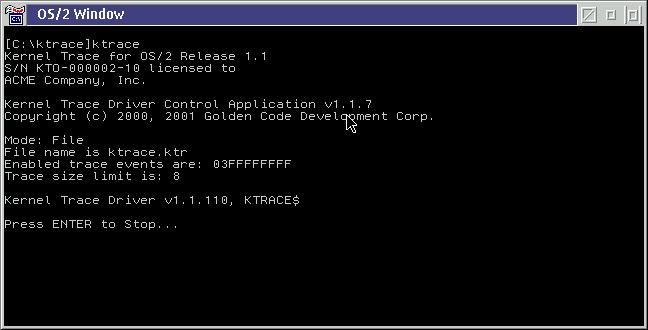
Tracing is stopped by pressing the <ENTER> key. It is also possible to stop tracing by running KTRACE.EXE again, using the -k option, or by pressing <CTRL-C> or <CTRL-Break>.
If no filename is specified with the -f option, then a trace with the default filename is created in the current directory.