Overview
Throughout this user manual, KTRACE, Kernel Trace for OS/2,
and Kernel Trace are used interchangeably.
Kernel Trace for OS/2 enables any OS/2 machine to generate a detailed
trace of system activity and requests made of the OS/2 kernel. This
trace is written to a binary file for later analysis, using the Golden
Code Trace Analyzer.
Kernel Trace leverages the hooks provided for an installable security
subsystem by OS/2, to collect useful information about the activity of
your applications and of the kernel itself (see Figure
1).
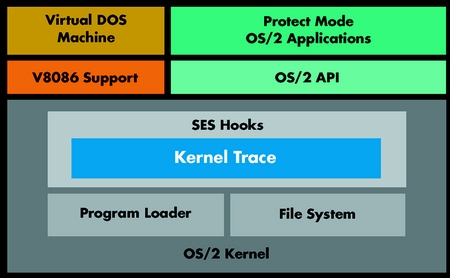
Figure 1 - High Level Kernel Trace Architecture
Functions
-
By leveraging IBM's Security Enabling Services (SES) interfaces in the
OS/2 kernel, Kernel Trace provides visibility to key kernel-level events,
without hindering the normal operation of the tracing machine. The
following kernel activity can be traced:
-
File Access
-
file open
-
file close
-
file read
-
file write
-
change pointer
-
File Manipulation
-
File Information/Attributes
-
query file info
-
set file info
-
set file size
-
set file mode
-
set path info
-
File Search
-
find first
-
find next
-
find close
-
Directory Manipulation
-
make directory
-
change directory
-
remove directory
-
Program Execution
-
execute program
-
loader open
-
get module
-
create VDM
-
Set Date/Time
-
Direct Disk Access (DosDevIOCtl Categories 8 and 9)
-
Traced activity may be filtered using:
-
Process Filter - limits traced activity to that which is generated by processes
which match those specified:
-
a match string can be specified which will include only events from processes
that have a matching EXE name;
-
one or more hexadecimal process identifiers (PIDs) can be specified.
-
Tracepoint Filter - limits active tracepoints to those specified.
-
Filename Filter - limits traced activity to that which affects the specified
file (applies only to file-related tracepoints only; non-file tracepoints
are handled normally).
-
Trace data is written to a file on the local disk.
-
Detailed data is provided for each tracepoint, including function arguments
and return codes, where applicable.
-
Dynamic control of tracing state (active or dormant).
Features
-
Allows any OS/2 machine, local or remote, to generate a detailed trace
file.
-
Software-only implementation.
-
Hardware independent design.
-
No null modem cable required.
-
Minimal impact on system resources when dormant
-
less than 193KB RAM
-
minimal CPU utilization.
-
Command line interface (ktrace.exe) is designed to:
-
operate well with existing remote management technologies, such as telnet
or Netfinity® manager;
-
enable automation via REXX.
-
Filters are available to reduce tracepoints to a subset of those available,
reducing the size of the resulting trace file and simplifying analysis.
-
Trace files generated are easily analyzed with the Golden Code Trace Analyzer
TM.
-
Configurable maximum file size - the trace will automatically end when
the file reaches the specified size.
-
Configurable amount of record payload output - the trace can capture a
variable amount of data from the buffer.
-
User specified output filename (defaults to ktrace.ktr).
-
User specified trace file comment.
-
Tracing can be ended using the <ENTER> key OR using the stop
option to ktrace.exe. Trace data will be saved to file.
-
Tracing can be aborted using <CTRL-C> or <CTRL-Break>.
-
License verification mode to verify and display the license key file.
©
2001 Golden Code Development Corporation. ALL RIGHTS RESERVED