
Figure 1. Trace record represented as a protocol stack |
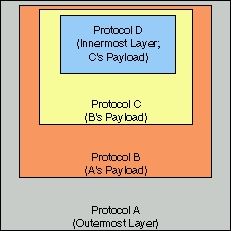
Figure 2. Trace record represented as nested protocols |
A record-oriented trace file is a binary file or a text file which represents a series of events which occur over a period of time. Information about each event is captured and recorded to file, usually in chronological order. The information for each event is recorded as a discrete entry in the file, known as a trace record, or simply, a record. Records might contain packets of network data that have been captured by a packet capture tool. Alternatively, they contain data generated by other means; for example, by tracing application programming interface (API) calls on an individual workstation.
A protocol-based trace record is one in which the information is organized based upon some known physical format or structure. Except in the simplest of cases, the format of a record is not represented by one, monolithic layout. Instead, a record's layout typically is comprised of multiple, smaller sub-structures, each of which encapsulates a specific piece of information about the event which the record represents. Each of these constituent sub-structures is termed a protocol layer, or simply, a protocol.
Often, trace records consist of multiple layered, or nested, protocols. Each lower protocol contains some information which determines the linkage to the layer above. This metaphor of a vertical layering of protocols is a common concept in networks, where one often thinks of protocols in terms of a protocol stack (see Figure 1).
Note: throughout this document, we shall refer to the layering or nesting relationship between protocols in terms of outer and inner (i.e., nested) protocols, rather than lower and upper protocols. In this paradigm, outer protocols are analogous to lower protocols; inner protocols are analogous to upper protocols (see Figure 2).The linkage between an outer protocol and an inner protocol is termed a binding. An inner protocol is said to be the payload of its enclosing, outer protocol, and is said to bind to that outer protocol. An inner protocol may in turn have its own payload, and so on, until the end of the data record is reached, at which point no further nesting is possible. In order for an analysis of a record's contents to be possible, a well defined mechanism must exist for determining how the protocols in a record are chained together via their bindings.
|
Figure 1. Trace record represented as a protocol stack |
Figure 2. Trace record represented as nested protocols |
Facilities are provided to view trace data in multiple ways, and to refine the data to a smaller subset of records, which may be more appropriate to the analysis task at hand. A flexible search engine can be used to locate quickly individual records which match user-defined criteria. Reports and data filters are completely customizable and, once created, can be saved for future use. These tools may be exported and imported, so that they can be shared among colleagues, moved to different workstations, or archived.
Trace data which has been organized and filtered to an appropriate subset
may be saved in its original file format or exported as comma- or tab-delimited
text. Reports can be printed in color or in black and white.
Various configuration options exist to allow a user to customize the representation
of the data to a particular environment, and to customize the product's
user interface.
Support for Network and Non-Network Protocols. Designed to be a general purpose analysis tool, the Trace Analyzer is not limited to network analysis. For example, in addition to broad network protocol support, v1.0 offers optional protocol support for Kernel Trace for OS/2, a Golden Code API tracing product for the OS/2 platform. Customizable Reporting System: Overview Reports are completely configurable, giving the user unprecedented control over the presentation and format of trace information. Existing reports can be changed or removed. New reports can be created to represent any combination of data from multiple protocols. Flexible Data Filtering: Using a straightforward and flexible expression syntax, the user can subset the data within a trace to include only those records which meet a defined set of criteria. Data filters can be created using an interactive user interface or can be automatically generated with a double click of the mouse. Flexible Search Engine: The same set of tools used for data filtering is used to provide a powerful search capability, requiring less of a learning curve. Printing with Preview: Reports can be printed in color or black and white. A useful print preview feature is provided to customize your print job and eliminate wasted paper. Symbolic Name Aliasing: Numerical addresses can be replaced with symbolic names meaningful to the user. Unlimited Bookmarks: Any number of individual records in a trace file may be bookmarked. Bookmarks can be used to create special report views and to define the contents of print jobs. File Save and Export: Any subset of trace file records can be saved in the format of the original file. Overview Report data can be exported for further manipulation as comma- or tab-delimited text. Export and Import Tools: Overview Report templates and data filters can be exported and imported for sharing or archival purposes. Summary Information: Useful summary information about a trace file is presented in its own report. Configurable User Interface and Data Representation: The user interface itself can be customized by the user, including the formats used to represent certain data types in reports. Cross Platform Portability. The Trace Analyzer was designed for and written purely in Java. In order to ensure portability, it includes no code native to any specific operating system. Tested platforms are listed in the Technical Specifications section.
Protocol Definitions. Within the context of the Trace Analyzer, this term refers to a logical mapping of a protocol, such as TCP or Ethernet, to a physical data representation which is loaded into the Trace Analyzer. Protocol definitions are essentially data plug-ins which tell the Trace Analyzer how to decode a particular protocol or set of protocols. A plug-in architecture for protocol support was chosen to enable extensibility; additional protocol support can be added to the product without requiring changes to the base product. For a list of protocol definitions supplied with the Trace Analyzer product, refer to the Supported File Formats and Protocols section.I/O Plug-ins. Every trace file organizes its records according to some well-defined file format. The Trace Analyzer uses a plug-in mechanism for its file format reading and writing support. This mechanism is designed to minimize the amount of effort necessary to add support for reading and writing a new trace file format. The software which supports the reading and writing of a particular file format is known as an I/O Plug-in. For a list of I/O Plug-ins supplied with the Trace Analyzer product, refer to the Supported File Formats and Protocols section.
Reports. Reports are the primary mechanism used by the Trace Analyzer to convey information about the data within a trace. The product uses several report types to represent the data within a trace file at various levels.
Data Filters. Data filters, or simply, filters, are the mechanism used by the Trace Analyzer to determine whether the data in an individual trace record meets a set of well defined criteria. Filters are used extensively, both for data searches and to refine a trace to a more meaningful subset of data. Filters are defined using a specific syntax. Users may modify existing filters, or may create new ones. For more information, refer to the Using Data Filters section.The Overview Report is a tabular report which summarizes the records within a trace file. The Overview Report may be modified by the user to contain a specific subset of records using data filters or bookmarks. Overview Reports are highly customizable through the use of report templates; the user may modify any report template provided with the tool, or may create new ones. The term "Overview Report" may be used to refer either to the interactive table component of the user interface which displays this report, or to a printed version of the data presented by this table. For additional information, refer to the Overview Report section. The Detailed Interpretation Report is an interpretive summary of an individual trace record. The interpretation presented contains the information deemed most significant to the protocol experts which have prepared protocol definitions used by the Trace Analyzer. This report is not customizable by the end user. The term "Detailed Interpretation Report" may be used to refer either to the component of the user interface which displays this report, or to a printed version of the data presented by this component. For additional information, refer to the Detailed Interpretation Report section. The Hex Dump Report is a presentation of the raw data of an individual trace record, presented as hexadecimal bytes, along with a direct translation of these bytes into ASCII or EBCDIC text. This report is not customizable by the end user, other than to toggle between text representation formats. The term "Hex Dump Report" may be used to refer either to the component of the user interface which displays this report, or to a printed version of the data presented by this component. For additional information, refer to the Hex Dump Report section. Symbolic Name Aliases. Symbolic name aliases, or simply, aliases, are meaningful text names supplied by the user or shipped with the product, which can be substituted for trace data in the Overview Report or Detailed Interpretation Report. In this version of the product, aliases can be used to represent an IP address, a MAC address, or the manufacturer ID portion of a MAC address. The use of aliases makes a report easier to understand by providing a more meaningful label for a piece of numeric data. For more information, refer to the Symbolic Name Aliases section.
Jobs. Within the context of the Trace Analyzer, a job refers to a unit of work which the program performs, such as printing a report, or indexing the records in a trace file, or applying a data filter. Jobs are handled by a Job Engine, which manages jobs according to a priority scheme, in which different types of work are assigned different priorities. Jobs generally are submitted for processing to the Job Engine as the result of some user action, such as loading a trace file, or initiating a search. The work a job performs may be in conflict with the work of another active or queued job. In this case, the user is asked to resolve the conflict. Jobs are explained in more detail in the Understanding Jobs section.